Pinnaya Research
The Indian dating conversation: what 262,502 Reddit posts reveal
Across two years of public Indian discussion about dating, dating apps, matchmaking and marriage, the frustrations people write about are overwhelmingly relational and structural. Product complaints are a rounding error next to them.
- Published
- 19 August 2026
- Period analysed
- 3 Aug 2024 to 3 Aug 2026
- Posts
- 262,502
- Comments
- 2,996,169
- Analytical base
- 127,140 posts
- Licence
- CC BY 4.0
Disclosure of interest. Pinnaya published this study, and Pinnaya operates in the market it examines. Pinnaya is an intentional dating app for urban Indian professionals. Read the findings with that in mind. The classification rules, the sample, the precision estimate, the failed tests and the full aggregate dataset are all published so that anyone can check the work independently. This study makes no claim that any product, including Pinnaya, solves the problems it describes.
Download the evidence
Free · CC BY 4.0 · No form
- For journalistsPress fact sheetPDF, 3 pagesDownload PDF
- For publishingChart packZIP, 4 PNGsDownload ZIP
- For analystsAggregate datasetCSV, 511 rowsDownload CSV
Reuse with attribution to Pinnaya.
How to cite this study
https://www.pinnaya.com/research/india-dating-conversation-study
The aggregate dataset behind every figure on this page is published as a CSV of 511 derived statistics. The methodology page documents the sample, the classification rules, the manual-audit precision estimate and the tests that failed.
The headline finding in one paragraph
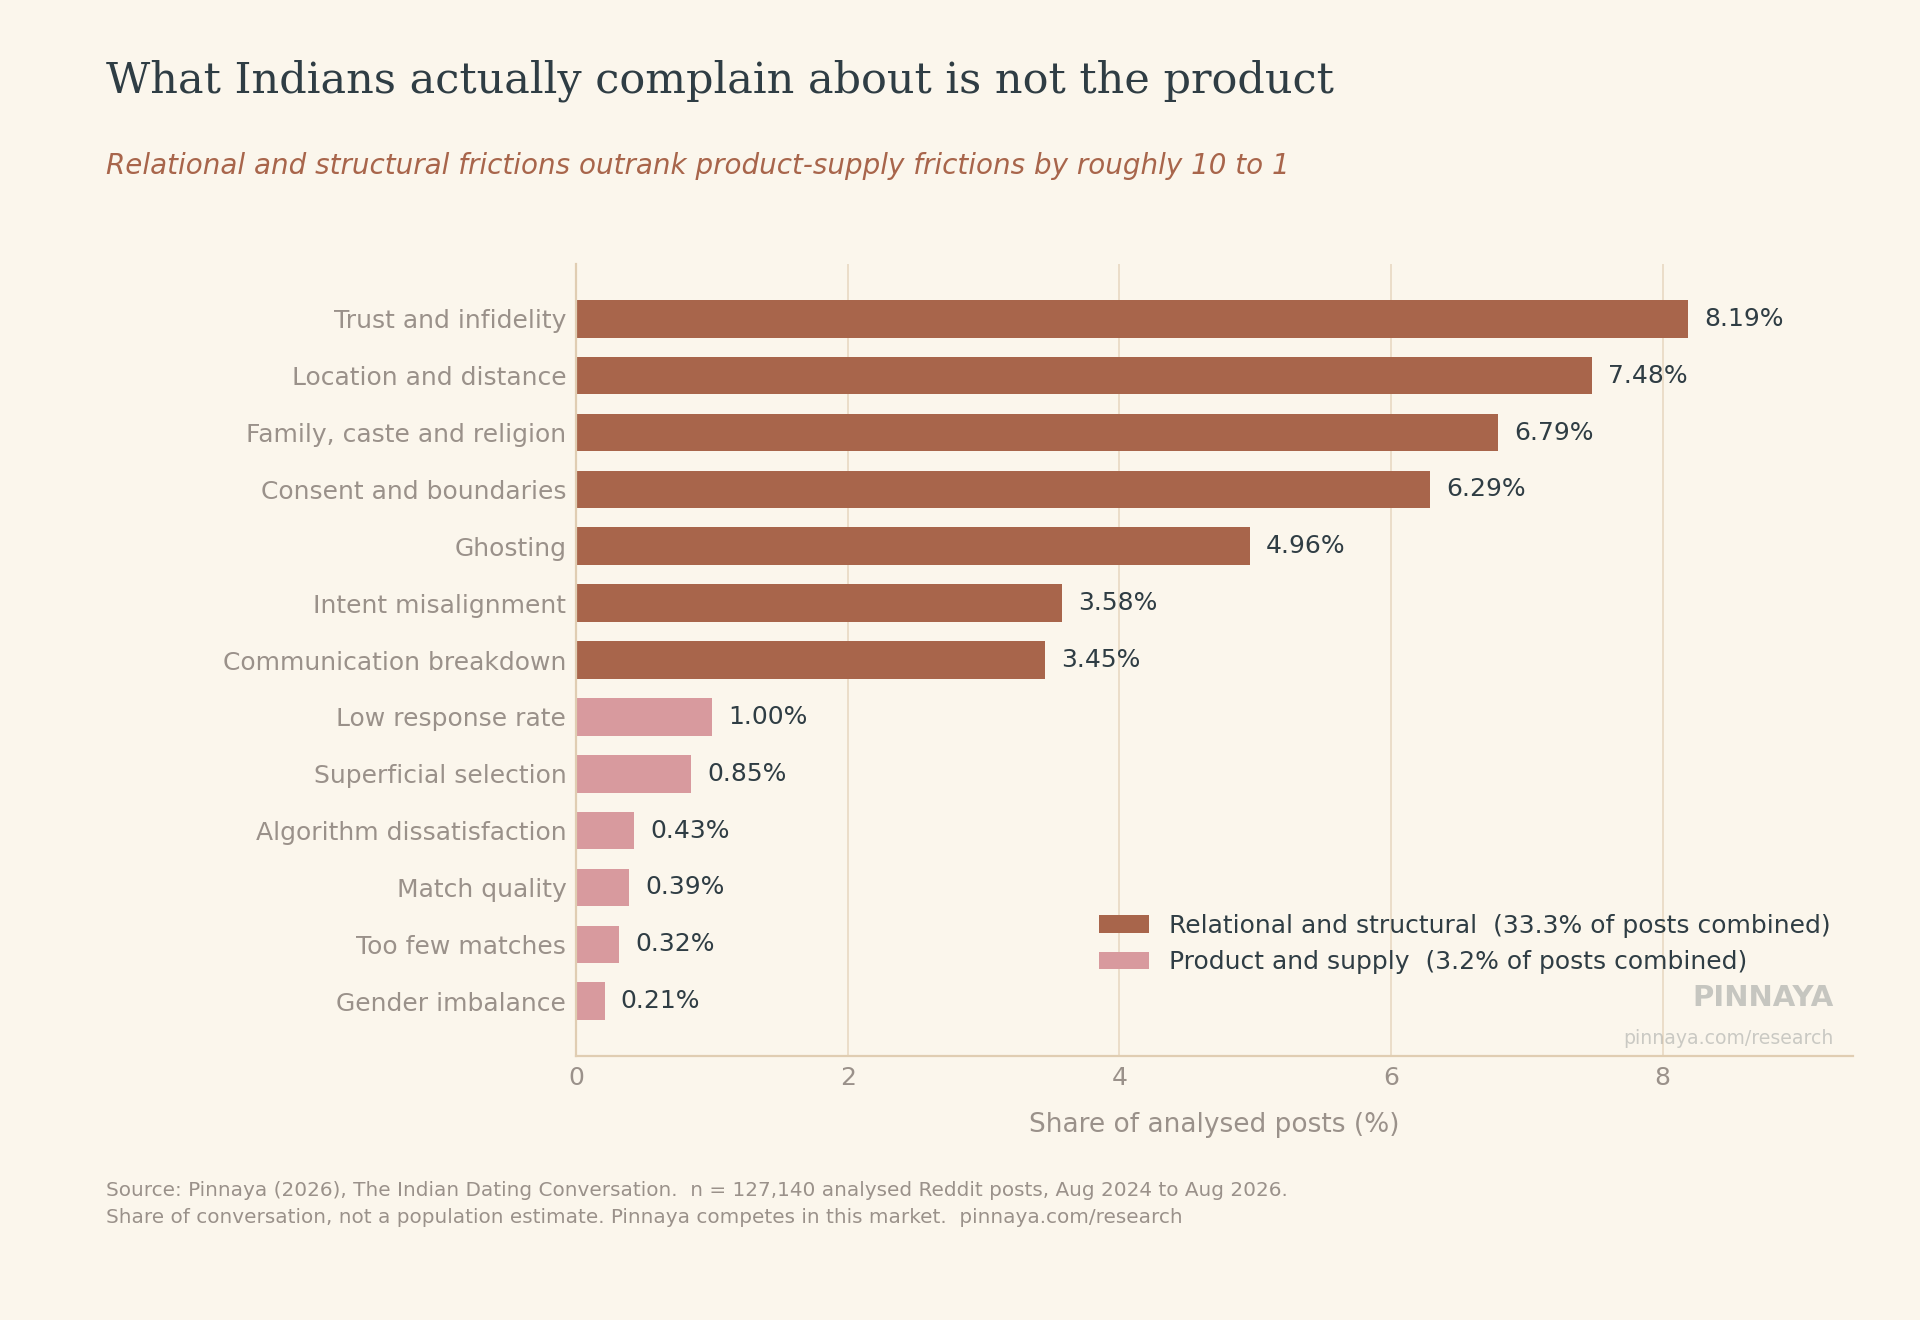
Across 127,140 analysable Indian posts about dating and marriage, frictions that dating products normally optimise against, meaning poor match quality, weak algorithms, too few matches, gender imbalance, low reply rates and superficial selection, appear in 3.2 percent of posts combined. Frictions that products mostly do not own, meaning trust and infidelity, family, caste and religion pressure, consent and boundary violations, communication breakdown, intent misalignment and ghosting, appear in 33.3 percent. That is a ratio of roughly 10 to 1.
Scope note: this study describes public Reddit conversation about dating in India. It is not a survey and not a population estimate. Reddit users are not a random sample of Indian singles.
This is the single most consistent result in the study. It holds when the analytical base is widened to include medium-relevance posts, when it is narrowed to only the eight communities that were traversed exhaustively, when the largest single community is removed, and when every community is removed one at a time. The largest shift any of those tests produces in any individual friction is 2.24 percentage points.
Why are dating apps so frustrating in India?
Indian dating-app frustration is mostly not about the app. In 127,140 analysed posts, the most common frustrations are trust and infidelity (8.19 percent of posts), distance and location constraints (7.48 percent), family, caste and religion pressure (6.79 percent), consent and boundary problems (6.29 percent), emotional fatigue (5.82 percent) and ghosting (4.96 percent). Complaints about match quality (0.39 percent) and algorithms (0.43 percent) are rare by comparison.
The pattern is that people write about relationships failing, not about feeds underperforming. Discovery is where dating products concentrate their engineering, and it is the smallest part of the expressed problem. The conversation concentrates instead on what happens after two people match, and on the surrounding constraints of family, geography and social expectation that no product currently touches.
Confidence: high. Rank order is stable across all six sensitivity tests. Maximum shift under leave-one-community-out is 2.24 percentage points.
What do Indians complain about most on dating apps?
The most common complaints in Indian dating conversation are trust and infidelity (8.19 percent of 127,140 posts), location and distance (7.48 percent), family, caste and religion pressure (6.79 percent), consent and boundaries (6.29 percent) and emotional fatigue (5.82 percent). Paywall and pricing complaints appear in only 3.19 percent of posts but generate the highest engagement of any friction, at 16.9 comments per post against a corpus mean of 14.0.
| Friction | Posts | % of base | 95% CI | Comments per post | Engagement index |
|---|---|---|---|---|---|
| Trust and infidelity | 10,411 | 8.19 | 8.04-8.34 | 14.8 | 106 |
| Location and distance | 9,508 | 7.48 | 7.34-7.62 | 11.9 | 85 |
| Family, caste and religion | 8,627 | 6.79 | 6.65-6.92 | 16.0 | 114 |
| Consent and boundaries | 7,999 | 6.29 | 6.16-6.43 | 14.6 | 104 |
| Emotional fatigue | 7,400 | 5.82 | 5.69-5.95 | 12.9 | 92 |
| Ghosting | 6,300 | 4.96 | 4.84-5.08 | 14.0 | 100 |
| Safety when meeting offline | 4,957 | 3.90 | 3.79-4.01 | 14.0 | 100 |
| Intent misalignment | 4,550 | 3.58 | 3.48-3.68 | 11.1 | 79 |
| Communication breakdown | 4,387 | 3.45 | 3.35-3.55 | 12.8 | 92 |
| Catfishing and scams | 4,239 | 3.33 | 3.24-3.43 | 12.7 | 91 |
| Paywall and pricing | 4,059 | 3.19 | 3.10-3.29 | 16.9 | 121 |
| Privacy and stalking | 3,361 | 2.64 | 2.56-2.73 | 15.7 | 112 |
| Harassment and unsolicited contact | 2,711 | 2.13 | 2.05-2.21 | 14.7 | 105 |
| Social stigma | 2,659 | 2.09 | 2.01-2.17 | 14.8 | 106 |
| Low response rate | 1,271 | 1.00 | 0.95-1.06 | 15.6 | 112 |
| Superficial selection | 1,086 | 0.85 | 0.81-0.91 | 15.9 | 114 |
| Marriage-timeline conflict | 750 | 0.59 | 0.55-0.63 | 13.4 | 96 |
| Algorithm dissatisfaction | 553 | 0.43 | 0.40-0.47 | 12.9 | 92 |
| Match quality | 496 | 0.39 | 0.36-0.43 | 13.2 | 95 |
| No offline opportunities | 416 | 0.33 | 0.30-0.36 | 8.4 | 60 |
| Too few matches | 403 | 0.32 | 0.29-0.35 | 11.8 | 84 |
| Profile authenticity | 400 | 0.31 | 0.29-0.35 | 16.8 | 120 |
| Gender imbalance | 266 | 0.21 | 0.19-0.24 | 11.7 | 83 |
Base: 127,140 high-relevance posts of at least 15 words, August 2024 to August 2026. Posts can carry more than one friction, so shares do not sum to 100. Engagement index is comments per post divided by the 14.0 corpus mean, times 100. Confidence intervals are Wilson 95 percent.
Prevalence and intensity are different variables, and the gap between them is where brand damage happens. Paywall and pricing is the eleventh most common friction and the most engaging one. Profile authenticity is twenty-second by prevalence and second by engagement. These are low-frequency, high-heat topics: rare enough to under-weight in a product backlog, hot enough to shape category perception when they surface.
An important null finding sits at the bottom of that table. “I have nowhere to meet people” is both the rarest complaint at 0.33 percent and the least-responded-to, at an engagement index of 60, the lowest of any friction measured. People ask, and the community has little to offer.
Confidence: high on prevalence and rank order. Medium on the engagement figures, because comment collection was exhaustive in eight communities and partial elsewhere.
Is dating app fatigue increasing in India?
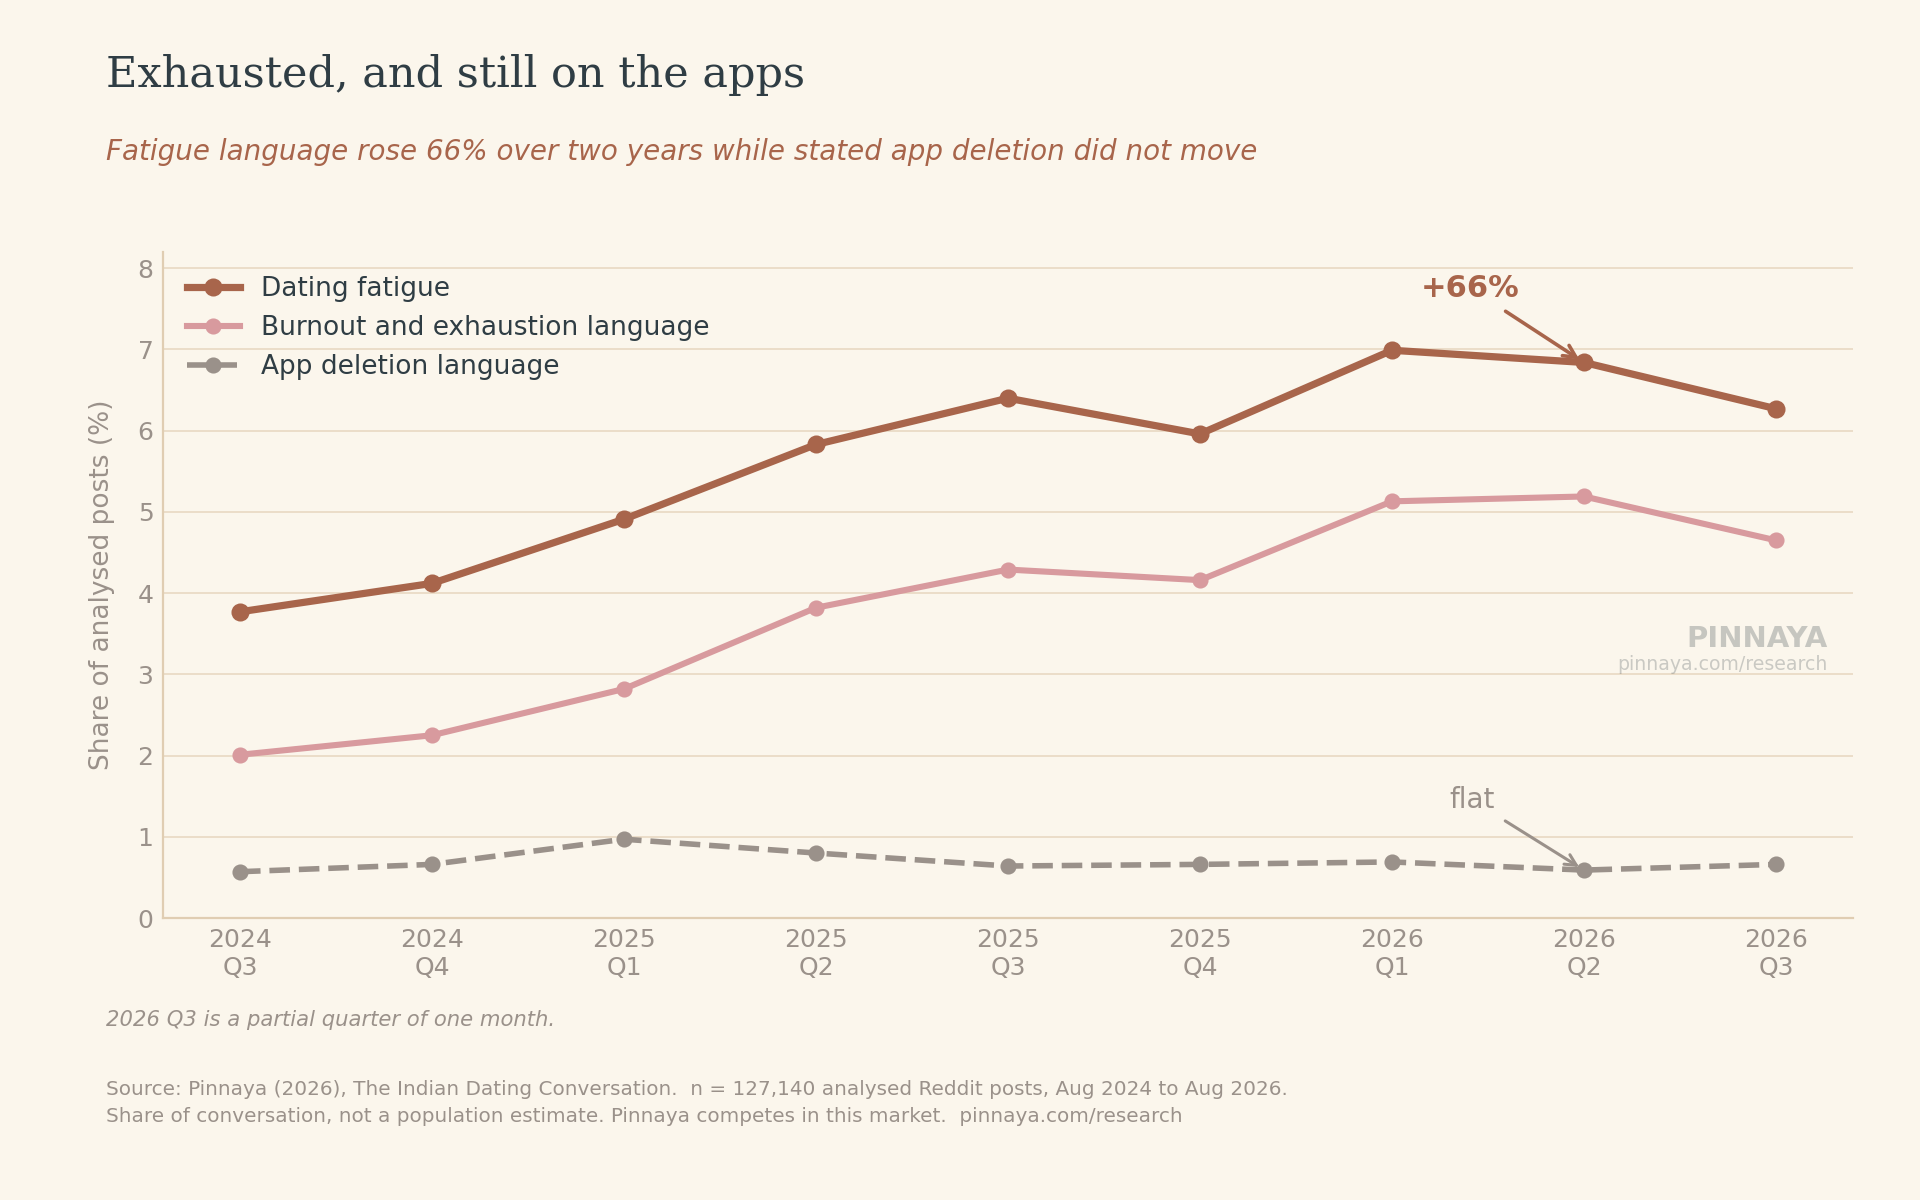
Yes. Dating fatigue is the only theme in this study with a sustained, statistically robust upward trend. Fatigue language rose from 3.95 percent of posts in the first two quarters to 6.55 percent in the last two, a 66 percent increase with non-overlapping 95 percent confidence intervals. Narrower burnout and exhaustion language rose 131 percent. Explicit app-deletion language stayed flat at 0.61 to 0.62 percent across the same period.
| Signal | 2024 Q3-Q4 | 2026 Q2-Q3 | Change | CIs separated | Survives core-only test |
|---|---|---|---|---|---|
| Emotional fatigue | 3.95% | 6.55% | +66% | Yes | Yes |
| Burnout and exhaustion | 2.13% | 4.92% | +131% | Yes | Yes |
| Loneliness | 4.92% | 5.55% | +13% | No | - |
| App deletion | 0.61% | 0.62% | +2% | No | - |
| Lowered expectations | 0.70% | 0.75% | +8% | No | - |
| Cynicism and loss of trust | 0.52% | 0.48% | -7% | No | - |
| Ghosting | 4.50% | 4.83% | +7% | No | No |
| Catfishing and scams | 3.17% | 3.23% | +2% | No | No |
| Paywall and pricing | 3.02% | 3.44% | +14% | No | No |
| Safety when meeting offline | 3.24% | 4.12% | +27% | Yes | No |
Quarterly bases run from 8,226 posts in 2024 Q3 to 18,443 in 2026 Q2. 2026 Q3 is a partial quarter of one month and 7,079 posts. A change is only called a trend when confidence intervals separate and the result survives restriction to the eight exhaustively-collected communities.
The strategically important pair is fatigue rising while stated exit is not. People are describing exhaustion at nearly twice the rate they did two years ago and describing deletion at exactly the same rate. Whether that gap closes into churn is not observable in this data, because people who leave stop posting.
A result that did not survive its own test
Discussion of safety when meeting offline appears to rise from 3.24 percent to 4.12 percent with separated confidence intervals. When the same test is run only on the eight communities that were collected exhaustively, the rise disappears. The apparent trend reflects a changing mix of communities in the sample over time, not a change in what people discuss. It is reported here as a negative result because it is exactly the kind of number that would otherwise be published as a headline.
Confidence: high on the fatigue trend itself. Medium on any reading that fatigue precedes churn, which this data cannot demonstrate.
What is the difference between dating apps and matrimony sites in India?
They fail differently. In matrimonial-context posts, family, caste and religion pressure appears in 15.43 percent of posts against 4.14 percent in dating-context posts, a 3.7 times gap. In dating-context posts, ghosting appears in 8.73 percent against 1.36 percent in matrimonial contexts, a 6.4 times gap in the opposite direction. Dating fails on accountability. Matrimony fails on negotiating other people.
| Friction | Dating context | Matrimonial context | Gap | Ratio |
|---|---|---|---|---|
| Family, caste and religion | 4.14% | 15.43% | -11.29pp | 0.27× |
| Ghosting | 8.73% | 1.36% | +7.37pp | 6.42× |
| Intent misalignment | 5.79% | 1.65% | +4.14pp | 3.51× |
| Trust and infidelity | 8.35% | 5.82% | +2.53pp | 1.43× |
| Catfishing and scams | 4.81% | 2.58% | +2.23pp | 1.86× |
| Consent and boundaries | 6.13% | 8.08% | -1.95pp | 0.76× |
| Harassment and unsolicited contact | 2.90% | 1.40% | +1.50pp | 2.07× |
| Comments per post | 10.9 | 20.4 | - | 1.87× |
Population: analysable posts whose text signals a dating context or a matrimonial context. 5,674 posts signal both and 50,801 signal neither; both groups are excluded from this comparison. Every gap shown has non-overlapping 95 percent confidence intervals.
One number in that table deserves separate attention. Consent and boundary friction is higher in matrimonial contexts than in dating contexts, at 8.08 percent against 6.13 percent. Structure, family involvement and declared marriage intent do not eliminate boundary violation. A process can be serious and still be coercive.
Matrimonial-context posts also draw 87 percent more comments than dating-context posts. Human-mediated channels extend the same pattern: posts mentioning family or community matchmakers draw 19.0 comments each, and posts mentioning the large matrimonial platforms draw 17.3 to 20.1, against 12.6 for the most-mentioned swipe app.
Confidence: high on the friction contrast. Medium on the engagement contrast, because comment collection was exhaustive for the largest arranged-marriage community and partial for several dating-heavy ones.
How common is ghosting on dating apps in India?
Ghosting appears in 4.96 percent of 127,140 analysed Indian posts about dating and marriage, and in 8.73 percent of posts written in a dating-app context. It is 6.4 times more common in dating contexts than in matrimonial contexts, where it appears in 1.36 percent of posts. Ghosting discussion did not increase over the two years studied.
The size of the dating-versus-matrimonial gap is the interesting part. In app-mediated discovery the other person can disappear at no social cost. In family-mediated matching they cannot, because a shared network carries the consequence. The 6.4 times gap is a measure of how much accountability the intermediary supplies, and it is the clearest quantitative statement in this study of what anonymous discovery actually costs its users.
Confidence: high. n = 6,300 posts tagged with ghosting; contrast intervals do not overlap.
Are dating apps safe for women in India?
Women describe more safety friction than men on every dimension measured. Among posts with a self-stated gender, women raise offline-meeting safety in 5.80 percent of posts against 4.01 percent for men, consent and boundary problems in 9.59 percent against 7.46 percent, and privacy or stalking in 3.19 percent against 2.44 percent. Safety, harassment, privacy and consent frictions together appear in 12.60 percent of all analysed posts.
| Friction | Men | Women | Ratio |
|---|---|---|---|
| Trust and infidelity | 10.54% | 13.32% | 1.26× |
| Location and distance | 10.46% | 12.95% | 1.24× |
| Consent and boundaries | 7.46% | 9.59% | 1.29× |
| Safety when meeting offline | 4.01% | 5.80% | 1.45× |
| Family, caste and religion | 7.67% | 9.42% | 1.23× |
| Communication breakdown | 4.14% | 5.63% | 1.36× |
| Emotional fatigue | 6.90% | 8.12% | 1.18× |
| Privacy and stalking | 2.44% | 3.19% | 1.31× |
| Comments received per post | 11.2 | 17.7 | 1.57× |
Gender is taken only from explicit self-reference in the text, such as an age-and-gender token or a first-person statement. Nothing is inferred from writing style, username or topic. 51.3 percent of the analytical base carries an explicit self-stated gender. Every gap shown has non-overlapping 95 percent confidence intervals.
LGBTQ+ posts carry roughly double the risk load and receive below-average community response
Posts written in an LGBTQ+ context, 3,029 posts or 2.38 percent of the base, show roughly double the rate of every risk friction: safety at 7.59 percent against 3.81 percent for all other posts, harassment at 5.65 percent against 2.05 percent, catfishing and scams at 6.50 percent against 3.26 percent, privacy at 4.95 percent against 2.59 percent, and stigma at 4.09 percent against 2.04 percent. These posts draw 9.7 comments each against a corpus mean of 14.0. The group describing the highest risk receives the least response.
Confidence: high on the gender contrast. Medium-high on the LGBTQ+ contrast, where 49.6 percent of that subset comes from a single community and community norms may amplify the pattern. An important caveat on both: a difference in how often a friction is named is not the same as a difference in how often it is experienced. Willingness to disclose varies.
How common are fake profiles and scams on Indian dating apps?
Catfishing, impersonation and financial scams appear in 3.33 percent of 127,140 analysed posts, rising to 7.03 percent in posts that reference a metro city. Profile misrepresentation appears separately in 0.31 percent of posts but generates the second-highest engagement of any friction, at 16.8 comments per post. Roughly 0.93 percent of posts, 1,177 in total, describe a safety incident as an outcome.
Scam discussion is a metro phenomenon in this data. Metro-referencing posts carry catfishing and scam friction at 7.03 percent against 4.95 percent in smaller-city posts, the one dimension on which metros are worse. Density creates both opportunity and predation. Recurring scam patterns described in the corpus are structured and repeatable rather than opportunistic, which is what makes them detectable in principle.
Confidence: high on prevalence, with one direction of error. These figures are almost certainly floors. Deleted and removed content was not retained at collection, and the most serious incidents are the most likely to have been removed.
Do dating apps work outside Indian metros?
Location is the dominant friction outside the metros. Among posts that explicitly reference a smaller city or town, 31.48 percent raise a location or distance constraint, against 5.74 percent of metro-referencing posts, a 5.5 times gap. Family, caste and religion pressure is roughly double outside the metros at 12.50 percent against 6.36 percent, as is trust friction at 11.04 percent against 6.11 percent.
| Friction | Metro | Smaller city | Ratio |
|---|---|---|---|
| Location and distance | 5.74% | 31.48% | 5.49× |
| Family, caste and religion | 6.36% | 12.50% | 1.97× |
| Trust and infidelity | 6.11% | 11.04% | 1.81× |
| Consent and boundaries | 5.67% | 9.98% | 1.76× |
| Catfishing and scams | 7.03% | 4.95% | 0.70× |
Only 13.9 percent of the analytical base carries an explicit city reference. All gaps shown have non-overlapping 95 percent confidence intervals.
Outside the metros the constraint is that there is nobody to meet and nowhere to meet them. Inside them the constraint is that you cannot tell who is real. These are opposite problems, and a single national product configuration is mispriced against both.
Confidence: medium. People are more likely to name their city when the city is the problem. That self-selection inflates the gap by an unknown amount. The direction is reliable; the 5.5 times magnitude is not.
Are dating apps worth it in India?
This study cannot answer whether dating apps are worth it, and no honest reading of it should claim to. What it shows is the shape of what people write: negative outcomes appear about twice as often as positive ones, at 13.12 percent of posts against 6.70 percent. It also shows that people who post about dating are self-selected toward having a problem, which makes that ratio a property of the medium as much as of Indian dating.
| Outcome | Posts | % of base |
|---|---|---|
| Advice request, no outcome stated | 13,496 | 10.62 |
| Breakup or rejection | 10,765 | 8.47 |
| Mixed or ambiguous | 6,731 | 5.29 |
| Negative | 5,917 | 4.65 |
| Marriage or engagement | 4,029 | 3.17 |
| Positive | 2,432 | 1.91 |
| Relationship formed | 2,054 | 1.62 |
| Safety incident | 1,177 | 0.93 |
| Platform abandonment | 902 | 0.71 |
| Platform switching | 346 | 0.27 |
Outcome is the least precisely classified dimension in this study; most posts state no outcome at all.
One compositional detail is worth reading past the headline ratio. Marriage or engagement is reported nearly twice as often as “relationship formed”, at 3.17 percent against 1.62 percent. In this conversation the celebrated milestone is the wedding, not the relationship. Any success metric that stops at a match, or even at a relationship, is measuring something the market itself does not treat as the finish line.
Confidence: medium. Severe self-selection toward problem-posting. This table describes what gets written, not what happens.
Where do Indians meet partners outside dating apps?
Rarely discussed, and poorly answered when it is. Social media is the most-mentioned discovery channel at 8.54 percent of posts, ahead of every named dating app. Meeting through an existing social circle appears in 3.57 percent, family or community matchmakers in 0.94 percent, offline events and speed dating in 0.47 percent, and professional matchmakers in 0.18 percent. The friction “I have nowhere to meet people” appears in only 0.33 percent of posts.
Two readings are available and this data cannot separate them. Either people cannot articulate demand for a category that barely exists in their market, in which case the low numbers understate a real need. Or offline introduction is genuinely unwanted, unaffordable or socially awkward, in which case the low numbers are accurate. The engagement premium on channels that already have a human in the loop, 19.0 comments per post for family and community matchmakers against 12.6 for the most-mentioned swipe app, is real evidence for the first reading. The 0.02 percent of posts stating an explicit preference for family-assisted or offline discovery is real evidence for the second.
A widely-repeated claim this data does not support
Explicit statements of preferring family-assisted or offline discovery over apps appear in 31 posts, or 0.02 percent of the analytical base, and did not grow across the two years studied. Whatever is happening in the Indian marriage market, this corpus contains no evidence of a stated retreat from apps back toward family matchmaking. The claim is common; the supporting conversation is not here.
Confidence: low to medium. This is the least settled section of the study and is published as an open question rather than a finding.
Data appendix: how often each platform is discussed
Read this before the table
These figures are share of conversation, not market share. They do not measure installs, users, revenue or product quality. A platform can gain conversation share by being disliked as easily as by being liked, and two of the largest communities in this sample are built around dating-app screenshots, which inflates app discussion generally. Pinnaya competes in this market and did not include itself in the measurement. This table is published for completeness rather than as a finding, and it is deliberately placed outside the study’s conclusions.
| Platform or channel | Posts | % of base | Comments per post | 2024 Q3-Q4 | 2026 Q2-Q3 |
|---|---|---|---|---|---|
| Social media (Instagram, Snapchat and similar) | 10,856 | 8.54 | 14.5 | 7.45% | 8.66% |
| Hinge | 7,621 | 5.99 | 15.6 | 4.88% | 8.07% |
| Bumble | 6,321 | 4.97 | 14.3 | 6.18% | 3.96% |
| Other or unnamed dating apps | 5,559 | 4.37 | 12.8 | - | - |
| Existing social circle | 4,533 | 3.57 | 12.0 | 3.38% | 3.57% |
| Tinder | 3,310 | 2.60 | 12.6 | 2.99% | 2.41% |
| Family and community matchmakers | 1,201 | 0.94 | 19.0 | 0.86% | 1.02% |
| Shaadi.com | 975 | 0.77 | 17.3 | 0.72% | 0.62% |
| Grindr | 885 | 0.70 | 4.1 | - | - |
| Offline events and speed dating | 599 | 0.47 | 9.7 | 0.34% | 0.55% |
| Jeevansathi | 556 | 0.44 | 20.1 | - | - |
| BharatMatrimony | 301 | 0.24 | 9.6 | - | - |
| Professional matchmakers | 228 | 0.18 | 12.7 | 0.16% | 0.19% |
| Aisle | 194 | 0.15 | 16.1 | - | - |
| Schmooze | 140 | 0.11 | 13.6 | - | - |
| Happn | 97 | 0.08 | - | - | - |
| OkCupid | 84 | 0.07 | - | - | - |
Base: 127,140 analysed posts. Brand aliases were normalised. The Hindi word for wedding was excluded from the matrimonial-brand match to avoid false positives. Quarterly columns are shown only where the sample supports them. Two of the eight exhaustively-collected communities are dating-app screenshot communities, which raises app-mention rates across the board.
The category-level reading is the defensible one: brand mindshare in Indian dating conversation is unstable, with individual named platforms moving by a factor of roughly two in either direction inside 24 months. The consistent structural finding is that human-mediated channels draw the most discussion per post while occupying under 2.5 percent of mentions.
How this study was done
This study analyses 262,502 unique public Reddit posts and 2,996,169 unique comments from 48 India-focused and India-relevant communities, posted between 3 August 2024 and 3 August 2026. Headline figures use 127,140 of those posts: the high-relevance posts of at least 15 words. Classification is rule-based and fully published. Manual audit precision on the high-relevance tier is 92.8 percent, with a 95 percent confidence interval of 84.0 to 96.9 percent.
| Stage | Posts | Stage | Comments |
|---|---|---|---|
| Raw rows collected | 265,311 | Raw rows collected | 2,996,169 |
| Duplicates removed | 2,809 | Duplicates removed | 0 |
| Unique posts | 262,502 | Unique comments | 2,996,169 |
| High relevance | 186,679 | Bot and automoderator | 168,581 |
| Medium relevance | 72,105 | Moderator boilerplate | 3,001 |
| Low relevance or false positive | 3,717 | Low information | 302,975 |
| Analytical base | 127,140 | Clean comments | 2,521,779 |
Provenance. The underlying records were obtained from the Arctic Shift public research archive, a free, open-source archive of historical Reddit data built for researchers, and not from Reddit’s own data API. This study redistributes none of that source material: only derived aggregate statistics are published, and author identifiers were never collected.
The unit of analysis is the post. The 2.99 million comments are used for engagement and context, never as independent respondents, because comments are nested within posts and within communities and treating them as three million observations would overstate precision by roughly an order of magnitude.
Two views are reported throughout: the corpus as collected, and a balanced view that gives equal weight to each of the eight communities collected exhaustively. Every proportion carries a Wilson 95 percent confidence interval. A difference between groups is only reported when the intervals do not overlap. A change over time is only called a trend when it is sustained, interval-separated, and still present when the analysis is restricted to the eight exhaustively-collected communities.
Read the full methodology, including the collection design, the classification rules, the two corrections that manual auditing forced, the six sensitivity scenarios and every known limitation.
What this study cannot tell you
Reddit users are not a random sample of Indian singles. This corpus skews young, urban, English-writing and internet-native. Every figure describes the captured conversation, not the Indian population. No number on this page is a population estimate, and no causal claim is made anywhere in this study.
- Not a population sample. The findings describe people who write about dating on Reddit in English.
- Two collection strata behave differently. Eight communities were collected exhaustively, with 98.0 percent audited precision. Forty were reached by keyword search, with 80.0 percent precision. Headline results are reported for both.
- Comment coverage is uneven. 71.9 percent of posts have collected comments, and coverage is exhaustive only inside eight communities.
- Self-reported, unverified segments. Gender is stated in 51.3 percent of the base and city in 13.9 percent. Nothing is inferred from writing style, username or topic.
- Rule-based classification. Sarcasm, irony and code-mixed Hindi, Malayalam and Hinglish are systematic sources of error. Audited precision on the high-relevance tier is 92.8 percent.
- Removed content is invisible. Deleted and removed posts and comments were not retained, so the safety figures in particular are floors.
- Naming a friction is not the same as experiencing it. Group differences in how often something is written about may reflect differences in willingness to disclose.
- The final quarter is partial. 2026 Q3 covers one month and 7,079 posts, and is treated as partial throughout.
Individual posts and comments are not quoted, linked or identified anywhere in this study or its published dataset. Only aggregate statistics are released. Author identifiers were never collected.
Frequently asked questions about this study
How many posts and comments were analysed?
This study analysed 262,502 unique Reddit posts and 2,996,169 unique comments from 48 communities, posted between 3 August 2024 and 3 August 2026. Headline figures use an analytical base of 127,140 posts: those classified as high relevance to dating, matchmaking or marriage in India and containing at least 15 words.
Which is the best dating app in India according to this study?
This study does not rank dating apps and cannot identify a best one. It measures how often each platform is discussed, which is share of conversation and not a measure of quality, users, revenue or satisfaction. A platform can be discussed frequently because people are unhappy with it.
Does this study measure dating app market share in India?
No. Every platform figure in this study is share of conversation among posts analysed, not market share. The study does not measure installs, monthly active users, revenue or retention for any platform, and the sample is not representative of Indian dating-app users.
What is the single biggest finding?
Relational and structural frictions outrank product-supply frictions by roughly 10 to 1. Trust, family and caste pressure, consent, communication, intent misalignment and ghosting appear in 33.3 percent of analysed posts. Match quality, algorithms, too few matches, gender imbalance, low reply rates and superficial selection appear in 3.2 percent combined.
Is dating app burnout real in India, or is it a media story?
In this corpus it is measurable and rising. Dating-fatigue language rose 66 percent between the first and last two quarters studied, and narrower burnout language rose 131 percent. Both changes have non-overlapping 95 percent confidence intervals and both survive restriction to the eight communities collected exhaustively. Explicit app-deletion language did not rise over the same period.
What is the difference between a dating app and a matrimony site in India?
In this data they fail in opposite ways. Matrimonial-context posts raise family, caste and religion pressure at 15.43 percent against 4.14 percent in dating-context posts. Dating-context posts raise ghosting at 8.73 percent against 1.36 percent in matrimonial contexts. Consent and boundary friction is higher in matrimonial contexts, at 8.08 percent against 6.13 percent.
Why was Reddit used instead of a survey?
Reddit conversation is unprompted, which means the topics are chosen by the people writing rather than by a questionnaire. That is the main advantage over a survey and it comes with a matching disadvantage: the sample is self-selected and unrepresentative. This study is best used to find questions worth asking, not to estimate how common anything is in the Indian population.
Can I use this data or these figures?
Yes. The aggregate dataset of 511 derived statistics is published under CC BY 4.0 and may be reused with attribution to Pinnaya. Individual posts, comments, quotations, links and author identifiers are not published, are not available on request, and were excluded from every output by design.
Who published this study, and do they have an interest in the result?
Pinnaya published it, and yes. Pinnaya is an intentional dating app for urban Indian professionals and competes in the market this study examines. That is why the classification rules, the precision estimate, the sensitivity tests, the results that failed those tests and the full aggregate dataset are all published alongside the findings.
What is intentional dating?
Intentional dating is the practice of dating with a stated purpose and a declared timeline, rather than open-ended browsing. In practice it means saying what you are looking for before you match, matching with fewer people at once, and treating the conversation after the match as the point rather than the volume of matches before it. Pinnaya is an intentional dating app built around that idea.
How do I contact the researchers or report an error?
Write to care@pinnaya.com. Press enquiries, data questions, methodology challenges and corrections all go to the same address. Corrections are published on the study page with a dated note rather than made silently.
Are the safety figures reliable?
They are floors rather than estimates. Deleted and removed content was not retained at collection, and the most serious incidents are the most likely to have been removed by moderators or by their authors. Safety, harassment, privacy and consent frictions appear in 12.60 percent of analysed posts, and the true rate of underlying experience is higher than that by an unknown margin.
About Pinnaya
Pinnaya is an intentional dating app for urban Indian professionals. Every member is verified with government ID and face matching, women decide when a match gets to see their photos and details, and each user holds a maximum of three active matches at a time. Pinnaya is positioned between swipe-based dating apps and traditional matrimonial platforms.
Pinnaya is live on iOS, Android and at Pinnaya.com. Pinnaya is incubated at IIMA Ventures and has filed two provisional patents. Pinnaya’s free Find Your Pattern tool takes about three minutes.
Pinnaya published this study because the questions it answers are the questions Pinnaya is trying to answer for itself. Nothing in the findings should be read as evidence that Pinnaya solves them.
Press and data enquiries
Write to care@pinnaya.com. Press enquiries, data questions, methodology challenges and corrections all go to the same address. If you find an error in this study we want to hear it, and we will publish the correction on this page with a dated note rather than editing quietly.
The Indian Dating Conversation: What 262,502 Reddit Posts Reveal About Dating, Matchmaking and Marriage in India. Published 19 August 2026. Analysis period 3 August 2024 to 3 August 2026.
Aggregate findings released under CC BY 4.0. Attribute to Pinnaya. No individual posts, comments or user identifiers are published.
Download: Press fact sheet (PDF, 3 pages) · Chart pack (ZIP, 4 PNGs) · Aggregate dataset (CSV, 511 rows)
Press and data enquiries: care@pinnaya.com